N A N O P R O B E S E - N E W S
Vol. 8, No. 9 September 30, 2007
Updated: September 30, 2007
In this Issue:
|
This monthly newsletter is to inform you about techniques to improve your immunogold labeling, highlight interesting articles and novel applications of metal nanoparticles, and answer your questions. We hope you enjoy it and find it useful; as always, let us know if we can improve anything.
. . . . . . . . . . . . . . . . . . . . . . . . . . . . . . . .
Nanogold® conjugates are most widely used for pre-embedding immunogold labeling: more publications describe its use for this than for any other application. In the current issue of Blood, Robert Flaumenhaft and co-workers use Nanogold-Fab' fragments as part of a study that provides the first description of a SNARE protein on the extracellular membrane. Nanogold conjugates are also widely used for neuroscience research, where their dense labeling and high penetration provide strong and reliable labeling.
|
Nanogold conjugates have a number of advantages over conventional colloidal gold probes that make them ideal for pre-embedding immunolabeling and many other gold labeling applications:
- Nanogold conjugates are the smallest gold immunoprobes you can buy: they penetrate and reach antigens inaccessible to other probes, up to 40 microns into cells and tissue sections. Fab' conjugates are the smallest and provide the highest penetration.
- The non-charged, solubilizing surface of the Nanogold particle provides low non-specific affinity and gives minimal background.
- Extremely uniform 1.4 nm diameter gold label and close to 1 Nanogold particle per Fab' or IgG give consistent, dense labeling that is the closest possible to quantitative.
- Highly receptive to silver enhancement; Nanogold-Fab' or streptavidin can visualize as little as 0.1 pg of target IgG on immunoblots.
- Gold is covalently attached to antibody IgG molecules and Fab' fragments at a site remote from the antigen binding region, so native immunoreactivity is preserved.
- High stability and long shelf life: conjugates show unchanged reactivity after storage for up to 2-3 years.
![[Nanogold conjugates: size comparison with colloidal gold, STEM micrograph and LM labeling (103k)]](../Images/Vol8_Iss9_Fig1.jpg) |
|
Upper Left: Comparison of the size of Nanogold-Fab' (upper) with colloidal gold conjugate (lower) showing the smaller size and higher resolution of the Nanogold conjugate; blue spheres represent additional biomolecules used to stabilize colloidal gold. Lower Left: Scanning transmission electron microscope (STEM) image of Nanogold-labeled IgG, clearly showing that labeling with Monomaleimido-Nanogold (arrows) occurs specifically at a hinge thiol site on the IgG molecule. Right: Spindle microtubules labeled with anti-tubulin primary antibody followed by (LEFT) goat anti-mouse colloidal gold or (RIGHT) goat Fab' anti-mouse-Nanogold (Light micrograph courtesy of Dr. D. Vandr and Dr. R. Burry, Ohio State University. Original magnification = 1300x).
|
SNARE proteins direct membrane fusion events required for platelet granule secretion. They are oriented in cell membranes such that most of the protein resides in a cytosolic compartment. In previous studies of the subcellular distribution of 3 SNARE proteins in resting platelets, VAMP-3 was found primarily on platelet granule membranes; most SNAP-23 was located on plasma membranes, with the rest distributed between membranes of the OCS and granular membranes; and syntaxin-2 was found to be more equally distributed among the different membrane compartments. This arrangement provides a molecular basis for secretion of alpha-granules via the plasma membrane and OCS as well as for homotypic alpha-granule secretion.
For the current study, the authors used Nanogold labeling with silver enhancement to study the distribution of subcellular localization of SNARE proteins in activated platelets, using immunonanogold
staining and electron microscopy, in order to further evaluate the contribution of SNARE protein distribution to platelet granule secretion. Blood from healthy donors who had not ingested aspirin in the 2 weeks prior to donation was collected by venipuncture into 0.4% sodium citrate, then centrifuged at 200 x g for 20 minutes to prepare platelet-rich plasma for ultrastructural studies. Purified platelets were incubated with buffer, 100 µM SFLLRN, or 0.2 µM phorbol 12-myristate 13-acetate (PMA) fixed in 4% paraformaldehyde, and prepared for sectioning by washing in 0.02 M PBS, pH 7.4, transferring to microtubes, and centrifuging at 1500 x g for 1 minute. They were then resuspended in molten 2% agar and quickly recentrifuged. The resultant agar pellets were washed in PBS then immersed in 30% sucrose in 0.02 M PBS, pH 7.4, overnight at 4°C, embedded in OCT compound and stored in -176°C liquid nitrogen for subsequent use. Frozen 10-µm sections were cut with a standard cryostat and were collected on precleaned glass slides. These sections were air dried for 20 minutes before staining.
Immunonanogold staining and processing for electron microscopy was performed at room temperature on cryostat sections mounted on glass slides using the following procedure:
- Wash in 0.02 M PBS, pH 7.4 for 5 minutes.
- Immerse in 50 mM glycine in 0.02 M PBS, pH 7.4 for 10 minutes.
- Wash in 0.02 M PBS, pH 7.4 for 5 minutes.
- Immerse in 5% normal goat serum for 20 minutes.
- Incubate with primary antibody, at a dilution of 1:30 - 1:50, in rabbit polyclonal antiserum against the C-terminal end of SNAP-23 at a dilution of 1:50; or in an affinity-purified goat polyclonal antibody against the C-terminal end of syntaxin 1A, 1B, 2, and 3 at a dilution of 1:10 in 0.02 M PBS; or in a rabbit polyclonal antibody directed against the 12 N-terminal amino acids of VAMP-3 at a dilution of 1:30 to 1:50 (60 minutes).
- Washes in 0.02 M PBS, pH 7.4 (3 x 5 minutes).
- Incubate in secondary antibody, Nanogold Fab' goat anti-Rabbit IgG for SNAP-23 and VAMP-3 staining, or affinity-purified Nanogold Fab anti-Goat IgG for syntaxin-2 staining, diluted 1:50-100 in 0.02 MPBS, pH 7.4 (60 minutes).
- Washes in 0.02 M PBS, pH 7.4 (3 x 5 minutes).
- Fix in 1% glutaraldehyde in 0.02 M PBS, pH 7.4 for 2 minutes.
- Wash in distilled water (3 x 5 minutes).
- Develop with HQ silver for 6 - 10 minutes in the darkroom.
- Wash in distilled water (2 x 2 minutes).
- Immerse in 5% sodium thiosulfate for 1 minute.
- Wash in distilled water (3 x 5 minutes).
- Fix in 1% osmium tetroxide in Sym-Collidine buffer, pH 7.4 for 10 minutes.
- Wash in 0.05 M sodium maleate buffer, pH 5.2 for 5 minutes.
- Stain with 2% uranyl acetate in 0.05 M sodium maleate buffer, pH 6.0, for 5 minutes.
- Wash in distilled water for 5 minutes.
- Dehydrate in graded ethanols, then infiltrate with a propylene oxide-eponate sequence.
- Embed by inversion of eponate-filled plastic capsules over the slide-attached tissue sections.
- Polymerize at 60°C for 16 hours.
- Separate the eponate blocks from glass slides by brief immersion in liquid nitrogen.
- Cut thin sections with a diamond knife with an ultratome and collect sections on uncoated 200-mesh copper grids.
- View unstained grids with a transmission electron microscope.
The following 4 controls were performed to ensure the specificity of immunostaining:
- replacement of primary antibody by an irrelevant rabbit IgG or goat IgG;
- omission of specific primary antibody;
- omission of the secondary antibody; and
- omission of the HQ silver enhancement solution.
Examination of the labeled sections, however, demonstrated unexpected expression of SNAP-23 and syntaxin-2 on the extracellular surface of the platelet plasma membrane, and this was confirmed using flow cytometry of intact platelets, which showed that trypsin-sensitive SNAP-23 and syntaxin-2 localized to the extracellular surface of the plasma membrane. Acylprotein thioesterase 1 and botulinum toxin C light chain released SNAP-23 and syntaxin-2, respectively, from the surface of intact platelets. When resting platelets
were incubated with both acyl-protein thioesterase 1 and botulinum toxin C light chain, a complex that included both SNAP-23 and syntaxin-2 was detected in the supernatant, indicating that the extracellular SNARE proteins retain their ability to bind one another. These observations represent the first description of SNARE proteins on the extracellular surface of a cell.
Reference:
- Flaumenhaft, R.; Rozenvayn, N.; Feng, D., and Dvorak, A. M.: SNAP-23 and syntaxin-2 localize to the extracellular surface of the platelet plasma membrane. Blood, 110, 1492-1501 (2007).
Reference for preparation and immunostaining for electron microscopy:
- Feng, D.; Crane, K.; Rozenvayn, N.; Dvorak, A. M., and Flaumenhaft, R.: Subcellular distribution of 3 functional platelet SNARE proteins: human cellubrevin, SNAP-23, and syntaxin 2. Blood, 99, 4006-4014 (2002).
More information:
. . . . . . . . . . . . . . . . . . . . . . . . . . . . . . . .
As part of our continuing improvement of our reagents and their support, we monitor the properties and performance of our Nanogold® reagents regularly. As a result of these measurements, we have determined updated, more accurate values for the extinction coefficients of our 1.4 nm Nanogold labeling reagents, Monomaleimido Nanogold, Mono-Sulfo-NHS-Nanogold, and Monoamino Nanogold. However, these values do not apply to NTA-Ni(II)-Nanogold, as explained below.
These are used to calculate the degree of labeling - usually expressed as the number of Nanogold particles per conjugate biomolecule. This is calculated from the UV/visible spectrum of the conjugate, and the extinction coefficients of the Nanogold and the conjugate biomolecule. The spectroscopic basis for this is shown below:
![[Nanogold-labeled Fab' UV/visible spectrum showing basis for labeling calculation (5k)]](../Images/Vol7_Iss10_Fig1.gif)
|
Upper left: UV/visible absorption spectra of Nanogold and Nanogold-labeled Fab' overlaid. For regions in the spectra where Fab' does not absorb, the spectra are identical and are represented by a single black line. Where Fab' absorbs, the conjugate spectrum is shown in red, and the Nanogold spectrum in black. Absorption due to the Fab' may be found for any wavelength by subtracting the absorption of the Nanogold (black) from that of the conjugate (red).
|
If you are labeling proteins, the extinction coefficients used for calculating labeling are those at 280 nm, where most proteins absorb strongly, which is used for protein quantitation, and at 420 nm, where Nanogold and undecagold absorb strongly, which is used for calculating the amount of gold. Extinction coefficients have been accurately determined for the two gold labels at 420 nm.
If you are labeling oligonucleotides, you will need the extinction coefficients at 260 nm, the wavelength at which oligonucleotides absorb most strongly, which is used for oligonucleotide quantitation. You can calculate the extinction coefficient for an oligonucleotide of known sequence by adding the extinction coefficients for its individual bases. Reference:
- Cavaluzzi, M. J., and Borer, P. N. Revised UV extinction coefficients for nucleoside-5'-monophosphates and unpaired DNA and RNA. Nucleic Acids Res., 32, e13 (2004).
The values for the extinction coefficients of Nanogold and undecagold at 420 nm are given below, with the extinction coefficient of undecagold and a representative value for that of Nanogold at 280 nm, along with the extinction coefficients for IgG antibody molecules and Fab' fragments. However, :
| Gold Label: |
E260nm |
E280nm |
E420nm |
E280nm/E420nm |
| Nanogold |
5.97 x 10⁵M-1cm-1 |
4.12 x 10⁵M-1cm-1 |
1.56 x 10⁵M-1cm-1 |
2.64 |
| Undecagold |
24.1 x 10⁴M-1cm-1 |
16.8 x 10⁴M-1cm-1 |
4.71 x 10⁴M-1cm-1 |
3.57 |
| IgG |
N/A |
2.25 x 10⁵M-1cm-1 |
~ 0 |
N/A |
| Fab' |
2.25 x 10⁵M-1cm-1 |
7.5 x 10⁴M-1cm-1 |
~ 0 |
N/A |
Note: The actual value for the extinction coefficient of Nanogold at 280 nm varies slightly from lot to lot. The most accurate value for the lot you are using will be given in the product specification sheet supplied with your product: use this value for the most accurate labeling calculation.
The labeling efficiency is usually expressed as the number of Nanogold particles per biomolecule; this is accurate provided unconjugated Nanogold or unlabeled biomolecules have been separated from the reaction mixture before the UV/visible spectrum is measured (for a detailed discussion on the best methods for separation, see our earlier article). In the spectrum of the Nanogold® or undecagold cluster, the ratio of absorbance at 280 nm to absorbance at 420 nm is always the same.
Conjugates of biomolecules with no absorbance at 420 nm
If your conjugate protein or biomolecule does not absorb at 420 nm, calculating the labeling is straightforward. The absorbance of the conjugate at 420 nm arises solely from the Nanogold, and can therefore be used to calculate the gold concentration directly:
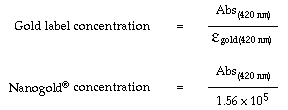
Next, the measured absorption at 420 nm is multiplied by the ratio of the extinction coefficient of Nanogold at 280 nm to its extinction coefficient at 420nm. This gives the absorption at 280 nm that is due to Nanogold. This is then subtracted from the measured absorption at 280 nm to give the absorption at 280 nm that is due to the protein:
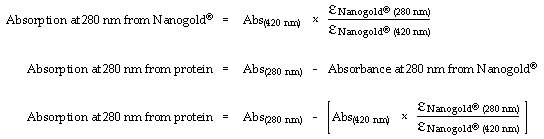
This value for the absorbance due to protein at 280 nm and the extinction coefficient of the protein at 280 nm are then used to calculate the protein concentration:
The labeling efficiency is the concentration of Nanogold® divided by the concentration of protein.
It should be noted that the absorption of your conjugate biomolecule may be small compared with that of Nanogold; for example, if you are labeling a small peptide or oligonucleotide with a relatively small extinction coefficient. In this situation, small errors in the overall measurements can produce large errors in the final calculation. It is therefore important to ensure that measurements are made with the highest possible accuracy and precision. You can ensure that your measurements are as accurate as possible by averaging multiple scans, running a blank cell with buffer as a baseline, and using a slow scan speed on your instrument.
Reference:
- Hainfeld, J. F. and Furuya, F. R. A 1.4nm Gold cluster covalently attached to antibodies improves immunolabeling, J. Histochem. Cytochem., 40, 177-184 (1992).
Conjugates of biomolecules with significant absorbance at 420 nm
For systems where the protein or biomolecule has significant absorbance in the visible range, the labeling calculation is more complex. Calculation of labeling is based on the solution of a pair of simultaneous equations, shown below, which describe the absorbance at 280 nm and 420 nm in terms of the contribution from each species:

Where:
c1 = measured absorbance at lambda = 280 nm
c2 = measured absorbance at lambda = 420 nm
a1 = extinction coefficient of protein at lambda = 280 nm
a2 = extinction coefficient of protein at lambda = 420 nm
x = concentration of protein (moles/liter)
b1 = extinction coefficient of gold cluster label at lambda = 280 nm
b2 = extinction coefficient of gold cluster label at lambda = 420 nm
y = concentration of gold cluster label (moles/liter)
Using Cramer's Rule to solve for x and y in terms of a, b, and c gives:

This gives the general solution shown below.
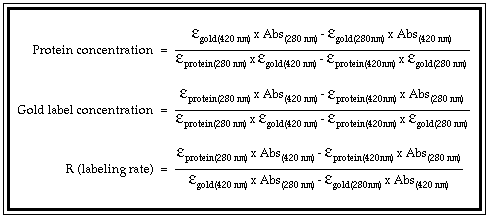
The method is given in full, with examples, in our Guide to Gold Cluster Labeling, on the advanced labeling calculation page.
Reference:
- Hainfeld, J.F. and Furuya, F.R. A 1.4nm Gold cluster covalently attached to antibodies improves immunolabeling, J. Histochem. Cytochem., 40, 177-184 (1992).
NTA-Ni(II)-Nanogold
An important exception to these values is our NTA-Ni(II)-Nanogold® reagent. This is prepared using a slightly different gold nanoparticle to those used for our other Nanogold reagents. It is slightly larger, with a diameter of 1.8 nm, and stabilized using a different ligand complement. This helps to provide enhanced stability and stronger binding, as well as enhanced solubility in aqueous solutions and buffers. However, this also means that it has different extinction coefficients to those of regular Nanogold, and because of this, the labeling calculations will be different.
Preliminary data indicates that because of the larger size, the extinction coefficients are significantly higher, and the ratio of absorption at 280 nm (A280nm) : absorption at 420 nm (A420nm) slightly lower, for NTA-Ni(II)-Nanogold compared with our other Nanogold labeling reagents. As a result, using the extinction coefficients above may lead to overestimation of labeling. We are currently deriving accurate values for the extinction coefficients; preliminary estimates suggest values for NTA-Ni(II)-Nanogold of about 3 x 10⁵ M-1cm-1 at 420 nm, and about 6 x 10⁵ M-1cm-1 at 280 nm, are reasonable. When more accurate values have been determined and verified, they will be included on our web site and in the product information for NTA-Ni(II)-Nanogold. In the meantime, the best method for assessing labeling using NTA-Ni(II)-Nanogold is direct observation by electron microscopy.
More information:
. . . . . . . . . . . . . . . . . . . . . . . . . . . . . . . .
As an alternative strategy to our use of combined enzymatic and gold probes with fluorescent substrates for combined fluorescent and larger gold labeling, Kandela, Albrecht and co-workers have investigated the use of mixed labels, in which a primary antibody labeled with a gold nanoparticle is bound by a fluorescently labeled secondary antibody. Fluorescence quenching in conjugates where both colloidal gold and fluorophores are conjugated to the same antibody has been well-established; in previous presentations, Albrecht and Kandela and group reported that conjugating both a 5 nm gold particle and a fluorescent label to a single IgG molecule resulted in almost complete fluorescence quenching. However, when a 5 nm gold particle was conjugated to a primary antibody and a fluorescently labeled secondary probe was used with the gold-labeled primary, fluorescence intensities up to 50% of those found with fluorescently labeled secondaries were found, sufficient for effective fluorescent imaging. These results are now described in more detail in the current issue of Scanning.
![[Sequential larger gold and fluorescent labeling (26k)]](../Images/Vol8_Iss9_Fig2.jpg)
|
| Fluorophore |
Gold Label |
Förster Distance |
| Fluorescein |
Nanogold |
6.7 nm |
| Cy3 |
Nanogold |
4.8 nm |
| Fluorescein |
3 nm Gold |
7.7 nm |
| Fluorescein |
5 nm Gold |
15 nm |
| Fluorescein |
10 nm Gold |
20 nm |
|
|
Left: Schematic showing sequential combined gold and fluorescent labeling with a colloidal gold-labeled primary antibody, followed by a fluorescently labeled secondary antibody. Right: Förster distances for some fluorophore - gold nanoparticle pairs.
|
Spectrofluorometry studies showed that direct conjugation of different concentrations of IgG-Alexa Fluor®* 488, 546 and 594 to 18 nm or 5 nm colloidal gold, and also for conjugates of fibrinogen-Alexa Fluor®* (FGN-AF) 488, 546 and 594 to 18 nm or 5 nm colloidal gold resulted in an almost completely quenched fluorescence signal. The concentrations of IgG-Alexa Fluor®* used started at 100 µg/mL in the series of 1 : 1 dilution steps up to dilution of 1 : 1000. In all cases, the decrease in signal was more than 99% compared to the same concentrations of fluorescently labeled proteins when not conjugated to gold particles. Results were similar at all protein-AF concentrations, and no shift of excitation or emission wavelength was observed. Results obtained from spectrofluorometry showed that while the fluorescence signal quenching is greater than 99%, it is not completely diminished and a low fluorescence signal can be demonstrated after sufficient expansion of the intensity axis. In order to determine whether such conjugates could be used for actual imaging, the colloidal gold-IgG-Alexa Fluor®* conjugates were suspended in HEPES buffer in an oil emulsion. Additional exposure time did not improve detection, demonstrating that signals from conjugates were not visualized. Similar results were obtained after direct conjugation of 12 nm colloidal palladium to IgG-Alexa Fluor 488, 546 and 594 nm. The results showed that 99% of the signal was lost compared to the same concentration of IgG-AF, which was not conjugated to colloidal palladium particles.
To determine if quenching could be overcome by locating the fluorescent molecules farther from gold (1020 nm with indirect labeling, as opposed to 16 nm, with direct labeling), primary IgG was conjugated
to 5 or 18 nm colloidal gold, then subsequently labeled with secondary anti-IgG-Alexa Fluor®* (AF). With AF attached to the secondary antibody, the results showed that >50% and 20% of the fluorescence signal (or 50% and 80 % quenching) was detected with 5 and 18 nm colloidal gold respectively in comparison to IgG-AF, which was not conjugated to colloidal gold. Even with this degree of signal loss, these labels could be readily observed using fluorescence LM, and the colloidal gold readily localized by electron microscopy.
Reference:
- Kandela, I. K., and Albrecht, R. M.: Fluorescence quenching by colloidal heavy metals nanoparticles: implications for correlative fluorescence and electron microscopy studies. Scanning, 29, 152-61. (2007).
More information:
*Alexa Fluor is a trademark of Molecular Probes / Invitrogen.
. . . . . . . . . . . . . . . . . . . . . . . . . . . . . . . .
We have reported extensively on the difficulties that fluorescence quenching by large gold particle labels presents to efforts to carry out correlative fluorescent and gold labeling using either larger gold labels, or using different sized gold labels to distinguish multiple sites. Following their earlier presentation at Microscopy and Microanalysis 2005, Albrecht and group have continued to developed a novel approaches to the issue of multiple labeling, and now present a full paper describing multiple correlative labeling using immunoprobes conjugated with Cy2 or Cy3 fluorophores as light microscopic reporters, and 6 nm nanoparticle labels of gold or palladium as electron microscopic labels.
![[Correlative double immunofluorescence and EM labeling scheme (41k)]](../Images/Vol6_Iss8_Fig1.jpg)
|
left: Effect on fluorescence intensity for fluorescently labeled secondary antibody bound to 6 nm gold-labeled primary (top), and fluorescent and 6 nm gold-labeled primary antibody. right: schematic showing labeling of myosin with 6 nm gold and Cy5 (Z bands) and labeling of alpha-actinin with 6 nm palladium and Cy2 (I and A bands).
|
Correlative labeling was carried out as shown above. The authors prepared 6 nm colloidal particles of gold and palladium using conventional reductive methods, and conjugated these respectively to mouse anti-myosin and goat anti-alpha-actinin primary antibodies. These were then detected with donkey anti-mouse conjugated with Cy3 (emission maximum at 552 nm), and donkey anti-goat IgG conjugated to Cy2 (emission maximum at 492 nm), respectively for fluorescence observation. Correlative double immunolabeling was carried out on 70nm Epon sections of skeletal muscle tissue; before labeling, these were etched using sodium or potassium ethoxide to reduce antigenic masking. The colloidal metal labels were distinguished by Electron Spectroscopic Imaging (ESI).
By light microscopy, the signal pattern of the Cy3 signal showed the known distribution of myosin in the A band of muscle tissue. In contrast, the Cy2 signal displayed a narrow banded pattern, corresponding to the well-known presence of alpha-actinin in the Z lines. In the electron microscope, the colloidal gold and colloidal palladium were distinguished by ESI using a Leo 912 energy filtering transmission electron microscope equipped with an Omega filter. Images were formed using inelastically scattered electrons of specific energy losses associated with specific elemental compositions; the three window method was used for extrapolation of background, with two images taken at energy losses before and one image at the maxima of gold and palladium. The distribution of the filtered signals for each element was also found to reflect the known distribution of myosin and alpha-actinin. This approach may be extended to particles of other compositions, enabling multiple correlative labeling; it is limited only by the resolution of electron spectroscopic imaging, which currently requires at least a 3 - 5 nm particle for detection.
Reference:
- Kandela, I. K.; Bleher, R., and Albrecht, R. M.: Multiple correlative immunolabeling for light and electron microscopy using fluorophores and colloidal metal particles. J. Histochem. Cytochem., 55, 983-990 (2007).
Correlative fluorescent and immunogold labeling may by achieved using the FluoroNanogold line of combined fluorescent and gold labeled Fab' conjugates available from Nanoprobes, which are the only commercially available conjugates with both labels and are available with the very bright Alexa Fluor® 488 and 594 labels developed by Molecular Probes. These may be enlarged using silver or gold enhancement for differentiation in the electron microscope.
More information:
. . . . . . . . . . . . . . . . . . . . . . . . . . . . . . . .
We have recently updated all our material safety data sheets (MSDSs) to reflect our updated address, and to link them to our web site catalog pages. Since many of our products are new compounds, MSDS data are often severely limited; however, we are continuously working to improve this information and keep our MSDSs up-to-date. If you have a specific question that the MSDS does not answer, please feel free to contact us
More information:
. . . . . . . . . . . . . . . . . . . . . . . . . . . . . . . .
Histotechnological processing of DNA can cause damage and loss as well as structural and reactivity changes, and as a result DNA probes have severe tissue-staining limitations. Gagna, Kuo and co-workers have developed a novel DNA staining technique and histotechnological processing procedure that improves tissue-bound DNA retention and the qualification and quantification of intact, double-stranded (ds)-B-DNA. The ultrasensitive PicoGreen ds-DNA probe was then used for histochemical characterization of ds-DNA. Fifteen fixatives were examined to determine which were best for preventing DNA denaturation and retaining original DNA content and structures. Use of a microwavevacuum oven reduced heating temperatures, shortened heating and processing times, and enhanced fixation. Better qualitative and quantitative results were obtained by using superior tissue-acquisition techniques (e.g., reduced prefixation times) and improved histotechnology. The approach was also tested using archival tissues, delayed fixation, less sophisticated and conventional histological processing techniques, and by experimenting with preservation of tissue-bound ds-Z-DNA. Results demonstrate that the new procedure and nucleic acid staining method significantly improve the retention of intact, undamaged ds-DNA which, in turn, allows the investigator to more precisely quantify the content and structures of unaltered and undamaged tissue-bound ds-B-DNA.
Reference:
- Gagna, C. E.; Kuo, H. R.; Chan, N. J.; Mitacek, E. J.; Spivak, A.; Pasquariello, T. D.; Balgobin, C.; Mukhi, R., and Lambert, W. C.: Novel DNA Staining Method and Processing Technique for the Quantification of Undamaged Double-stranded DNA in Epidermal Tissue Sections by PicoGreen Probe Staining and Microspectrophotometry. J. Histochem. Cytochem., 55, 999-1014 (2007).
Hanauer and group demonstrate the separation of gold and silver nanoparticles according to their size and shape by agarose gel electrophoresis, after coating them with a charged polymer layer consisting of polyethylene glycol with the appropriate modifications, in the current Nano Letters. The separation is monitored optically using the size- and shape-dependent plasmon resonance of noble metal particles, and confirmed by transmission electron microscopy (TEM). Gold spheres and nanorods were effectively separated, as were gold and silver nanoparticles. Electrophoretic mobilities were quantitatively explained by a model
based on the Henry formula, providing a theoretical framework for predicting gel mobilities of polymer coated nanoparticles.
Reference:
- Hanauer, M.; Pierrat, S.; Zins, I.; Lotz, A., and Sönnichsen, C.: Separation of nanoparticles by gel electrophoresis according to size and shape. Nano Lett., 7, 2881-2885 (2007).
Bornhop and colleagues describe the use a microfluidic system with laser interferometry for label-free binding detection in a recent issue of Science. Free-solution, label-free molecular interactions were investigated using back-scattering interferometry in a simple optical train comprising a helium-neon laser, a microfluidic channel, and a position sensor. Molecular binding interactions between two proteins, between ions and protein, and between small molecules and protein, were determined with high dynamic range dissociation constants (Kd
spanning six decades) and unmatched sensitivity (picomolar Kds and detection limits of 10,000s of molecules). Equilibrium dissociation constants were quantified for protein A and immunoglobulin G, interleukin-2 with its monoclonal antibody, and calmodulin with calcium ion Ca2+, a small molecule inhibitor, the protein calcineurin, and the M13 peptide. The high sensitivity of back-scattering interferometry and small volumes of microfluidics allowed the entire calmodulin assay to be performed with 200 picomoles of solute. This provides a potentially highly sensitive method for studying binding interactions.
Reference:
- Bornhop, D. J.; Latham, J. C.; Kussrow, A.; Markov, D. A.; Jones, R. D, and Sorensen, H. S.: Free-solution, label-free molecular interactions studied by back-scattering interferometry. Science, 317, 1732-1736 (2007).
. . . . . . . . . . . . . . . . . . . . . . . . . . . . . . . .
|